 |
version
for WindowsXP
|
| Paths | Nodes | CSUs | Timetables | Vehicles | Metrolines | |
|
Paths: Paths are accessed by means of a right-mouse-click on the path object. This presents a floating menu to the user with the following options: Path->Properties: gives access to a property box where most variables of the path can be set or changed (see figure). Path->AverageTime: allows the user to set the average travel time associated to that path. Path->RisePriority: allows the user to rise the priority of the 'path'. A path with priority raised will be the first chosen by a vehicle if there are alternative ways to the next station (CSU). |
 |
|
|
|
|
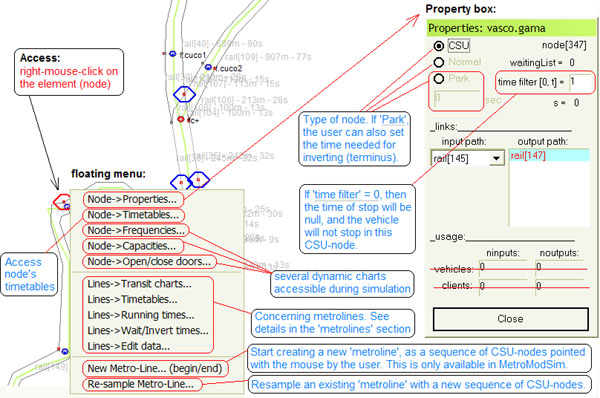
Nodes: A right-mouse-click on a node gives access to a floating menu from where several commands can be executed; some related to the node itself, some related to metrolines. For now you may focus the attention on: Node->Properties: leads to the property box for configuring the node. Node->Timetables: gives access to the node's timetables, related to the metrolines using the node. |
 |
|
|
|
|
CSUs: A right-mouse-click on a CSU gives access to a floating menu. Only two commands are enabled. CSU->Name: allows the user to insert or modify the name of the metro station or cross represented by the CSU object. CSU->Next icon: toggles the icon between a '+' for crosses, and a 'M' for metro stations. |
 |
|
|
|
|
Timetables: To access the 'timetables' of a node, use right-mouse-click on that node. Chose ''Node->timetables'. Node->Timetables will ask you to specify which 'metroline' you want to inspect, and then presents the correspondent timetable, if available, in a dialog box. Use this dialog box either to specify the injection of vehicles, or to inspect the automatically generated timetable. |
 |
|
|
|
|
Vehicles: In this simulator version, vehicle objects are not accessible to the user. Vehicles are shown as coloured circles with the same colour of their metrolines. Double vehicles (2 wagons) are shown as 'bigger' circles than normal vehicles (1 wagon). 1 wagon = 216 persons. Once injected, vehicles remain circulating in the system till the end of simulation. |
 |
|
|
|
|
Metrolines: Access metrolines data by choosing the 'Lines->EditData' option in any node's floating menu; or directly from the main toolbar. A dialog box will appear (see figure). Then, select a metroline from the list and inspect or modify its variables. Notice that some variables are computed only during the simulation process. |
 |
|
|
|
|
Contacts: J. Manuel Feliz-Teixeira emails: [email protected]; [email protected] urls: http://www.fe.up.pt/~feliz; http://geinsrv.fe.up.pt/feliz |