 |
version
for WindowsXP
|
| Menu options | Node timetables | Timetable dialog | Timetable charts | Frequency | Capacity | Open/close dooors | Transit charts | Lines timetables | Running times | Wait/invert times | Metrolines data | Circles model | | |
|
Menu options: Most of the simulator's outputs are accessible through the node's floating menu. Call this menu with a right-mouse-click in the node you want to inspect. Results are mainly organized as results related to the node, and results related to the metrolines passing through the node. |
 |
|
|
|
|
Node timetables: Timetables are directly associated to metrolines, so, each 'node timetable' is for a specific metroline passing through that node. This command will later give access to a 'timetable dialog'. |
 |
|
|
|
|
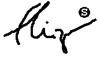
Timetable dialog: In response to the node's menu option 'Node->Timetables', the simulator will ask you to choose which timetable passing through the node you want to inspect. After that, a 'timetable dialog' appears, where from you may finally inspect and change several variables related to the timetable.
|
 |
|
|
|
|
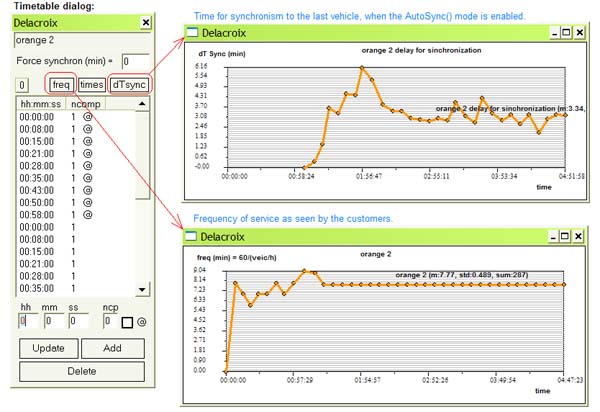
Timetable charts: Some data in the form of charts is available directly from the 'timetable dialog'. The most interesting: dTsync: shows a chart representing the variation along the time of the time for synchronism in the present node (only if there is injection of vehicles in this node, or the synchronism is forced by some minutes). AutoSync() must also be enabled. |
 |
|
|
|
|
Frequency: A chart plotting the frequency of service as it is seen by the customer is at any time available during the simulation run, for each metroline passing through the node. From any of these charts you can also have an idea not only of the average value of each frequency signal, but also on its standard deviation and integral value. This information appears next to each data series. |
 |
|
|
|
|
Capacity: As for the frequency, a chart plotting the transport capacity offered to the customer is at any time available during the simulation run, for each metroline passing through the node. You must add by yourself the individual capacities in order to compute the overall capacity in a certain node. Capacities are presented in places per hour, and considering wagons for 216 persons. |
 |
|
|
|
|
Open/close doors: Also the times of opening/closing doors are plotted along the time. They can be inspected through the node's floating menu. Notice:
|
 |
|
|
|
|
Transit charts: Although it is possible to inspect the 'transit chart' associated to a particular 'metroline', by pressing the button 'times' in the 'timetable dialog', the simulator gives also the possibility of inspecting all the 'transit charts' of the metrolines using a certain node. For this, use the command 'Lines->Transit charts' from the node's floating menu. Notice the functionality of the chart's floating menu. |
 |
|
|
|
|
Lines timetables: The command 'Lines->Timetables' forces the simulator to compute the average timetables for all the active metrolines in the system. Then, these timetables are saved in a file and presented to the user in the Notepad application. These timetables can probably be recommended for a certain operation of the metro network. |
 |
|
|
|
|
Running times: When a vehicle executes an entire circle in its metroline, it spends a certain time opening and closing doors, a certain time waiting for something, a certain time in termini operations, and a certain time simply running. The menu option 'Lines->Running times' gives the user an idea on how this last time changes along the time. |
 |
|
|
|
|
Wait/invert times: In the entire circle of its metroline, a vehicle spends a certain time opening and closing doors, a certain time running, a certain time in termini operations (inverting), and a certain time waiting for something. The menu option 'Lines->Wait/invert times' gives the user an idea on how these last times change along the time. They also can be easily compared. |
 |
|
|
|
|
Metrolines data: In order to inspect or modify the metrolines data, you have to call the 'metrolines dialog'. This can be done directly from the application's main toolbar or using the 'Lines->Edit data' command in the node's floating menu. Notice that certain variables of a metroline can be set by the user, while others are computed during the simulation process. |
 |
|
|
|
|
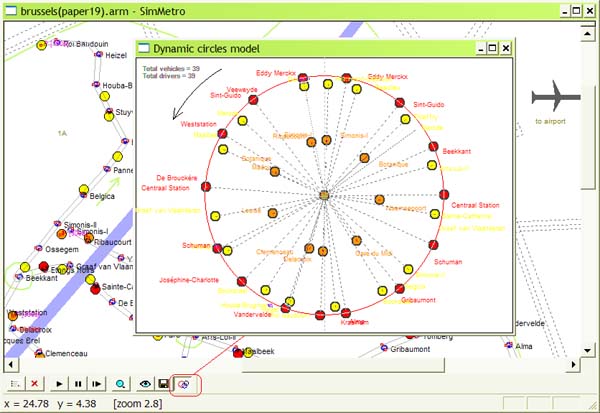
Circles model: This simulator includes the 'Circles Model', a novelty to analyse metroline dynamics. This model is created dynamically during the simulation process and can only be inspected while in the 'simulation mode'. You may access it, after some time of simulation, from the 'simulation menu' (see figure). |
 |
|
|
|
|
Contacts: J. Manuel Feliz-Teixeira emails: [email protected]; [email protected] urls: http://www.fe.up.pt/~feliz; http://geinsrv.fe.up.pt/feliz |