System
Architecture
The designed system consists in three components: the Matlab terminal, the database and the UI.
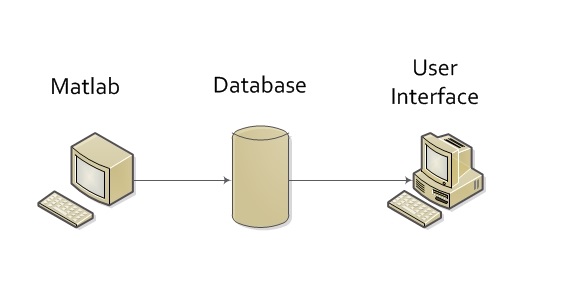
The Matlab terminal is responsible for analyzing the A/V content and to extract the features de-scribed earlier.
The Database is responsible for storing all the information regarding the features and the cat-egorization of the A/V content. It must have a way to receive information about the intrinsic characteristics of the content. Then it must use that information to categorize the content.
For an IPTV service simulation, the UI shows the program or video running at that moment and is waiting for a categorization so it can display a list of suggestions. That information is sent by the Database.
Functionalities
The system must be able to:
Database
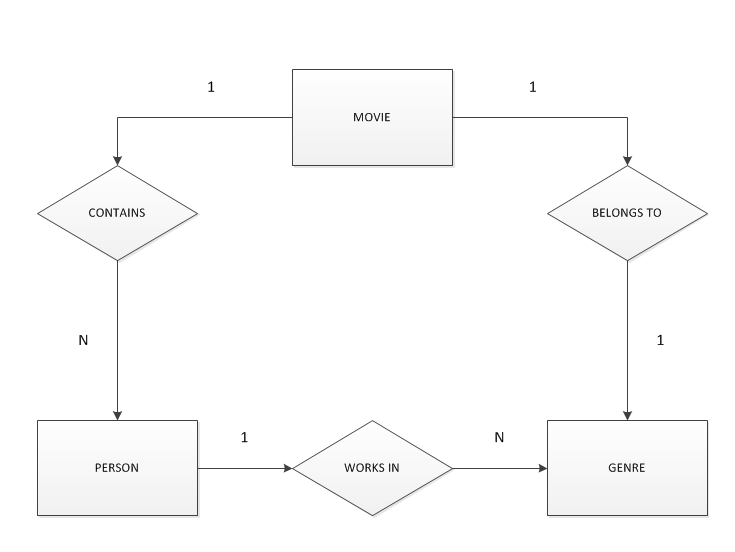
The database is composed by 3 associations: Movie, Person and Genre.
File contains information about the features extracted from the A/V content.
Person contains information about any person detected during the analyzis.
Genre contains the information (A/V features) that represent the content.
Interface
The interface was designed to simulate an environment in which the user is able to watch a random A/V content and after some time, it is presented a list of suggestions of other contents connected to whatever he is watching at that time.
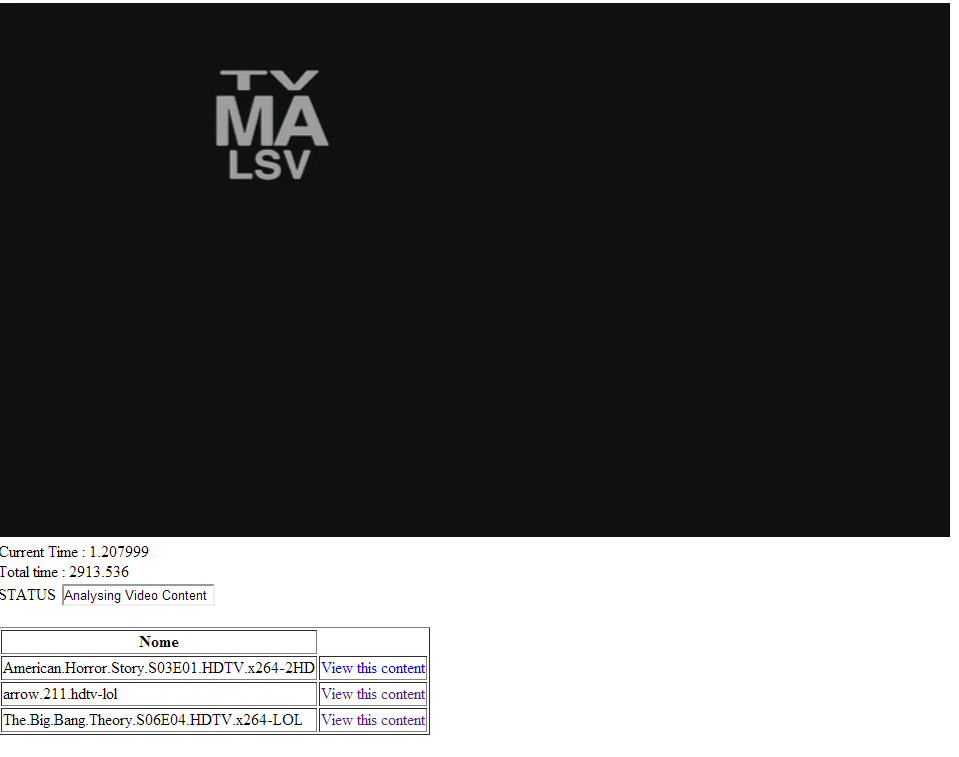
It is defined that the analyzis of the content will last 5 minutes before the UI displays the list of suggestions. After that time, the status will indicate that the results are ready, and by simply pressing a button, the list will pop-out.
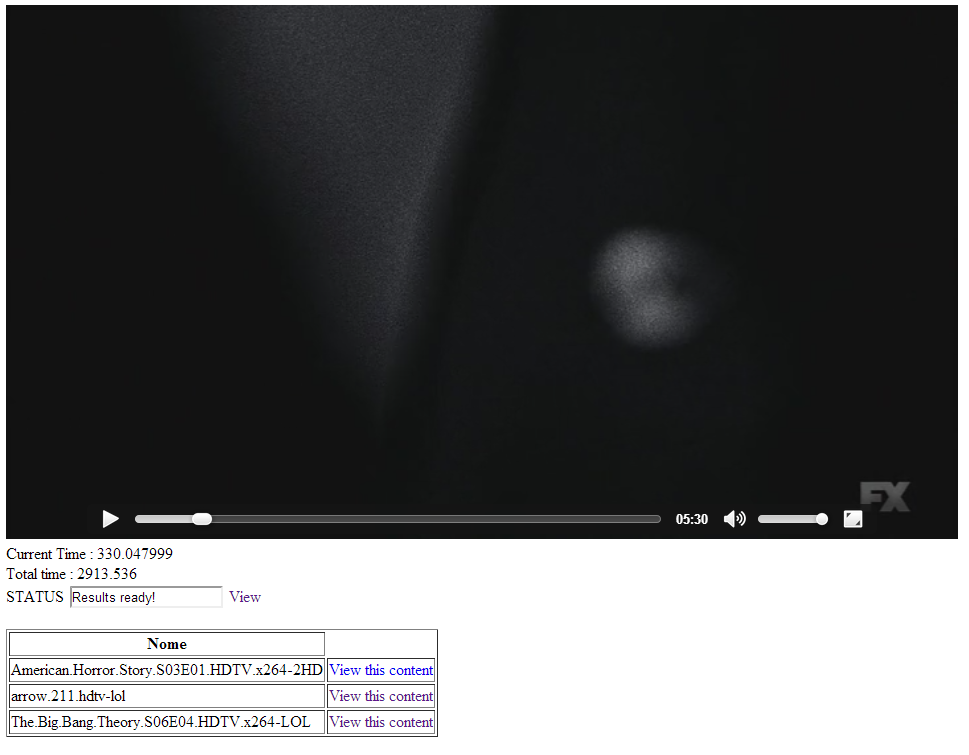
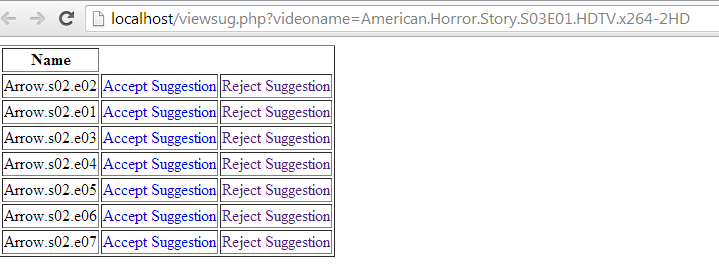
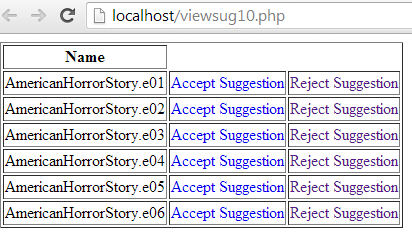
To get some feedback on the quality of the list displayed, the user has the option to accept or reject the suggestions. If it is rejected, the content will be analyzed for 5 more minutes , in a total of 10. This allows a possible better list of suggestions as the probability of the features converging to the values that characterize their genre is bigger.
Matlab
Shot boundaries detection
To extract some of the A/V features, it is mandatory to retrieve the boundaries of the scenes that compose the video. The transition between scenes is given by hard cuts, fades or dissolves, being the last the most unused. For that reason, the attention was given to detect hard cuts and fades.
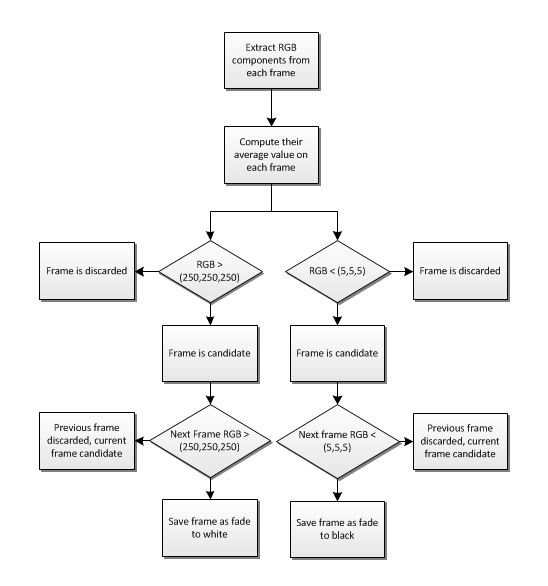
As fades are usually understandable as transitions from a scene to a black or white background or vice-versa, the criteria used to detect them is color. Black and white are formed by the combina-tion of RGB as (0,0,0) and (255,255,255), respectively. The algorithm to detect both transitions is described in image 4.1. As we are referring to fades, it wouldn’t be recommended that the value criteria for RGBwould be (0,0,0) and (255,255,255) as it could possibly not reach perfect black or white backgrounds, and even if it does, avoids the algorithm to enter on the detection phase only once. By using (5,5,5) and (250, 250, 250), there is a small margin to help the algorithm get a better performance.
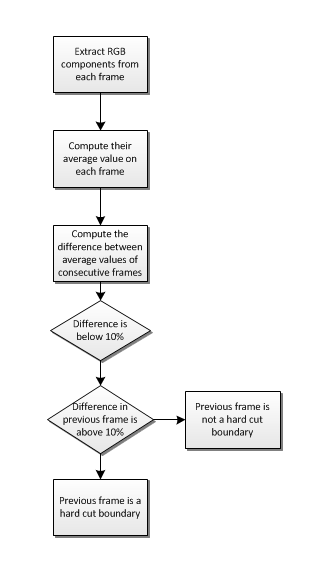
Hard cuts are perceived as complete alteration of the image displayed on a certain time of the movie. By using color difference between frames, it is possible to detect those changes. This value is obtained by subtracting the red,green and blue average values from the current frame with the previous one. As the calculations are made frame by frame, it is impossible to classify one frame as a hard cut boundary without computing the next.
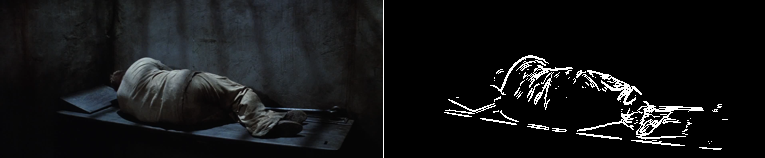
Motion
To calculate the motion feature between scenes, it is performed edge detection for every frame to isolate objects of interest. It is used the Sobel operator to calculate the magnitude of the gradi-ent. The image is then transformed to black and white to get better definition on the edges, and it is calculated the difference between consecutive frames to obtain an image that represents the movement of the objects of interest. To interpret the information this image gives, it is calculated the sum of ’1’ of the matrix, that represent the pixels that suffered transformations from ’0’ to ’1’ and vice-versa, being then divided by the size of the matrix (lines*columns) to obtain the percent-age of modified pixel values.