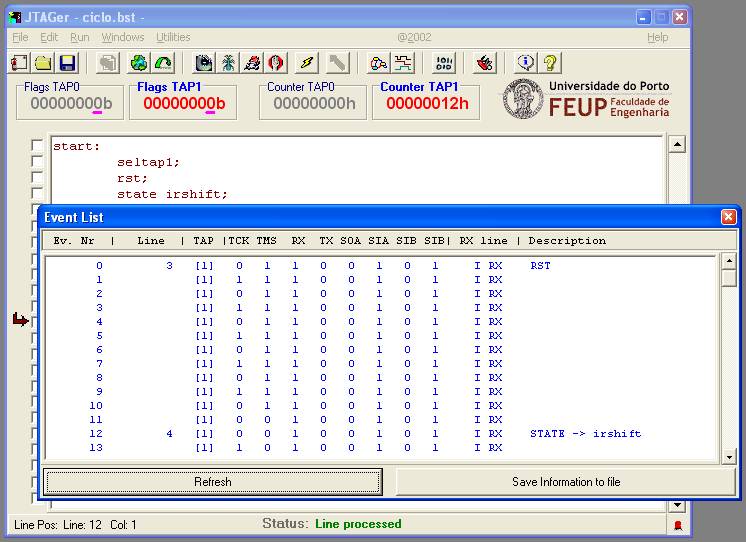
Fig. 1: Event list displayed by JTAGer.
Notice that the corresponding code line numbers are displayed on the second column, providing an easy reference to the test program source code. The text file produced by the "Save information to file" button contains all the events listed and may be opened by any other applications for further processing (e.g. MATLAB).