| The State Diagram entry in the Windows menu enables the
user to visualise the state transitions that take place during the
execution of the test program. This window displays the state diagrams of
both TAPs, as shown in figure 1 (transitions in red correspond to TMS=1,
in green to TMS=0). To remind the user that the TAP controller should
ALWAYS be reset at the beginning of each test program, each TAP state
diagram is initialised randomly. As illustrated in figure 1 below,
resetting the TAP controller may be done by including a RST command in the
first test code lines for each TAP.
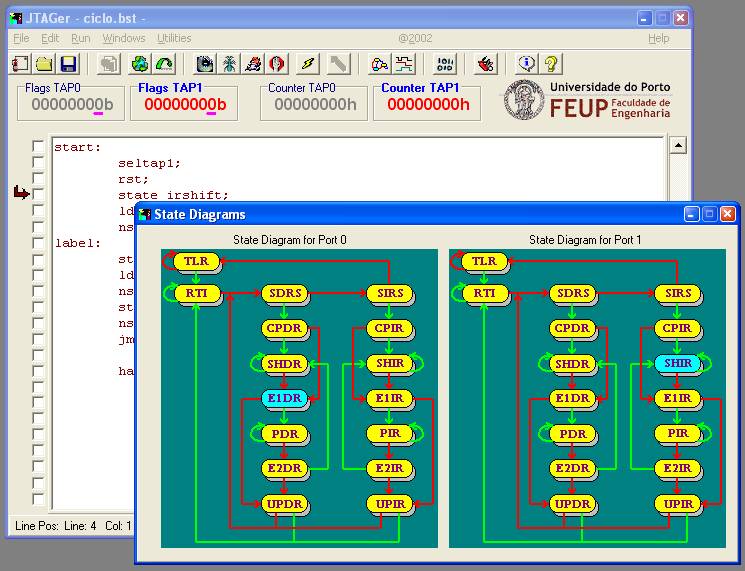
Fig. 1: State transition diagrams
displayed by JTAGer.
The user may define the state transition window to be always on top, by
clicking on the right mouse button over the window area and selecting
"Stay on Top" (the control bar buttons and all menu options in
the main JTAGer window continue to be active).
|