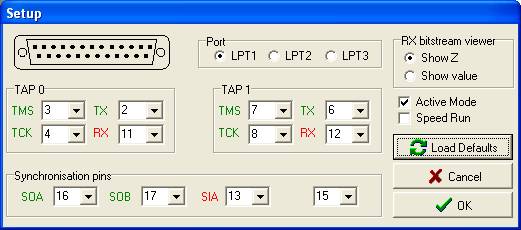
Fig. 1: JTAGer's default set up mode.
LPT1 (0x378) is the default parallel port, but the user may select LPT2 (0x278) or LPT3 (0x3BC) instead. It is also possible to modify the default allocation of pins, although it is unlikely that this will be necessary. Further to pin allocation, there are three main set up actions worth of mention:
-
RX bitstream viewer: except while in the Shift-XR state, the standard defines that the TAP TDO pin must remain in high impedance. However, and for the purposes of waveform display, the user may choose between displaying a "Z" symbol or the actual value (0/1) captured at the parallel port RX pin.
-
Active mode instructs JTAGer to store ALL events occurring as result of test program execution. This may lead to large memory requirements and only makes sense if you really need to know everything that happens since the first moment (this problem will become worse in Speed Run mode, since a much larger number of events is processed in the same time interval). The recommended set up is to keep the Active Mode option off, in which case you will still have access to the last 100.000 to 150.000 events (different instructions generate a different number of events).
-
Speed Run executes at the fastest possible rate, limited only by CPU performance. In this mode, JTAGer ignores menu and control bar commands (if your test code includes an endless cycle, Ctr+Alt+Del will then be your only way out). Speed Run should only be selected when dealing with test programs fully debugged, and when maximum speed is required.
The user may always return to the default settings by clicking on "Load Defaults", above the "OK" button.